
TARIFF TURBULENCE, ECONOMY HOLDS UP
Tariff policy—the announcements, reactions, and adjustments—were a defining feature of the second quarter. The country specific (“reciprocal”) tariffs announced on “Liberation Day” on April 2 were substantially larger than expected. The announcement disrupted global markets, heightening policy uncertainty and tightening financial conditions. A week later, this led the Administration to pause tariffs above 10% for most countries. In May, the tariff rate on Chinese goods was
lowered to 30% from 145%, which was enacted in April. These adjustments from the Administration to avoid worst-case economic outcomes helped catalyze a meaningful rebound in risk assets. Still, the average effective tariff rate of around 15% remains notably higher than its level last year, and there is considerable uncertainty about its future level. Longer-term effects on inflation and real economic activity remain unclear.
The new tariffs raised concerns about higher inflation and slower growth. Consumer and business sentiment surveys deteriorated in April due to the large spike in tariffs but recovered somewhat by the end of the quarter. Near-term inflation expectations rose. In several surveys, the majority of businesses said that they would pass at least some of the tariff costs to their customers. The so-called soft data, which includes measures of expectations, reacted more quickly to the policy changes than the hard data on prices and employment.
Despite the expected increase in inflation due to the tariffs, the inflation data in the second quarter surprised to the downside. The CPI YoY fell to 2.4% in May, down from 2.8% in February, and there were few signs of tariff-cost pressures. The modest increase in goods inflation was outweighed by further moderation in shelter and other core services inflation . Core CPI fell to 2.8%. PCE prices rose 2.3% YoY and Core PCE 2.7% YoY in May, both lower than February. Core services have been the source of excess inflation, so that these developments would have, in the absence of higher tariffs, set the Fed on the path to rate cuts. The uncertainty about how large and persistent the tariff effects on inflation will prove to be kept the Fed on pause.
The resilience of the labor market supported the Fed’s case for waiting. The labor market held up well in Q2 despite survey expectations for some softening. The unemployment rate was 4.2% in Q2, within the narrow range of the past year. Payrolls averaged 150,000 per month, up slightly from around 110,000 in Q1. Job gains were concentrated, and the hiring rate remained low. Wages rose 3.7% YoY in June, a bit below the 3.9% YoY pace in March.
The Fed held rates at 4.3%, extending the pause into the first quarter. In June, most Fed officials expected that it would be appropriate to reduce rates before the end of the year, but there was substantial disagreement on the magnitude. Some
officials did not see any cuts this year. The risks around tariffs were the driver of the Fed’s outlook. With inflation above the Fed’s 2% target for more than four years, the Fed is particularly sensitive to how tariffs might extend that gap. Unless the labor market weakens materially, we expect the Fed to remain on pause until the fall. Further increases in tariff rates could extend the pause.

QUARTER IN REVIEW
Following the shock of tariff announcements and accompanying spike in volatility on April 2nd, markets spent the rest of the quarter recovering. The nominal Treasury yield curve steepened with short rates falling and long rates rising as the combination of slower growth and greater deficits as a result of the budget bill was priced in. The real yield curve did the same curve shift, with short dated breakevens repricing inflation downwards. For the quarter, TIPS underperformed comparable Treasuries by 48 bps. Spread sectors marched tighter as volatility declined, with corporates recovering from the spread widening of early April. The Bloomberg Aggregate Bond Index returned 1.21%. Equities rebounded from Q1 declines, with the S&P returning 10.94%, as IT stocks, along with Metals & Mining, up over 20% in Q2. Small caps participated in the rally, but at 8.50% for the Russell 2000, they lagged large cap overall. In commodities, precious metals continued to rise, while fuel prices declined.
OUTLOOK
Macro uncertainty and market volatility is likely to persist through the second half of 2025, impacting consumer and business spending plans. After frontloading imports ahead of tariffs, we expect some near-term payback in consumption and growth. Tariff impacts should finally show up in inflation data in the next quarters.
Duration (Overweight): An increase in policy uncertainty and deterioration in the growth outlook in response to tariffs increases the risk of a recession. This should cause interest rates to fall from current levels. The Fed will proceed with a cautious approach to cutting interest rates given the risks of higher inflation in the near-term. However, a continued deterioration in the hard data over the coming months should force them to cut, potentially by a significant amount. The market implied long-term Fed Funds rate, at 3%, is too high. It should fall, potentially by another 50-75 basis points over time, to reflect the likelihood of a growth slowdown in the coming quarters.
Term Structure(Overweight intermediate maturity bonds): Favor intermediate maturity bonds based on our view the terminal Fed Funds rate is still too high. It should decline to reflect the risk of a recession in the coming quarters, which is bullish for intermediate maturity bonds. In addition, overweighting intermediate bonds gains exposure to a steepening yield curve (which we favor), while maintaining a duration overweight..
Credit (Underweight): Underweight given tight valuations that do not reflect risks of a slowing economic growth environment. See better value in agency MBS and ABS sectors. Favor 5-10 year maturities vs. an underweight in long credit, primarily in high quality 30 year Industrials. Prefer to stay up in quality in cyclically resistant sectors, and favor issuers with low event risk and a commitment to IG ratings. Also favor issuers and sectors that will be less impacted by tariffs, like telecommunications. Avoiding issuers and sectors that will feel a material negative impact from tariffs, have high M&A and re-leveraging risk or have a history of shareholder-friendly actions.
ABS (Overweight): ABS offers attractive carry and better downside protection vs. investment-grade credit. Favor digital infrastructure (data center and fiber securities).
Agency MBS (Overweight): Mortgages remain cheap relative to investment-grade credit. Favor lower coupon, credit impaired bonds which have higher prepayments, and will do well if the yield curve steepens. Also favor 5.0-5.5% coupon bonds (including CMOs) which offer attractive carry, enough discount to perform well into a rate rally, and limited extension risk.
Non-Agency RMBS (Overweight): Favor AAA-rated, deep discount, positively convex mortgages that will benefit from a rally in short and intermediate yields. Also favor new issue, high coupon securities with limited extension risk.
CMBS (Overweight) : Favor an overweight short maturity, AAA-rated CMBS relative to investment-grade credit. Select front-pay bonds trade at maximum extension and will benefit from unscheduled cash flows (defaults).
Inflation (Overweight): At 1.4-2.5%, real yields are too high. TIPS remain an attractive hedge for structurally higher inflation.
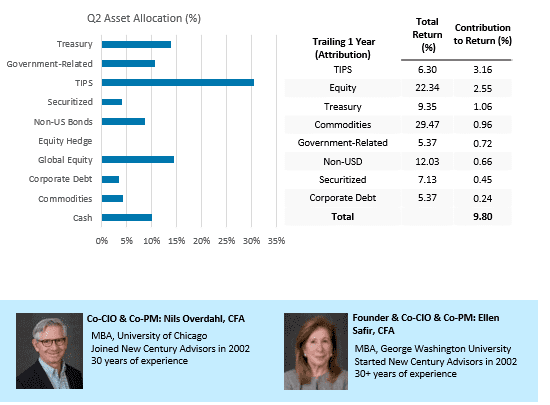
STRATEGY HIGHLIGHT- MULTI-ASSET
Our Multi-Asset strategy delivered a 2.81% return in Q2, exceeding CPI by 202 basis points. Markets remained sensitive to policy signals, and volatility was driven by fluctuating expectations around growth, inflation, and rates. Against this backdrop, our strategy remained both resilient and responsive. Performance was supported by targeted positioning, with all component asset classes having positive returns. Miners and non-U.S. equities were standout contributors and helped offset underperformance from MLPs and REITs. The weakening of the U.S. dollar enhanced the value of our local EM debt exposure, while declining yields boosted returns from short-duration TIPS and short Treasuries. Commodities were led by strength in precious metals, and callable agencies performed well, supported by strong carry. Our short-dated floating-rate corporate bond holdings benefited from the “higher-for-longer” policy stance, and agency MBS subtly added to returns.
We trimmed TIPS as inflation protection became fully priced, reduced inflation-sensitive assets such as MLPs and materials, and added selectively to risk after the post-tariff selloff. Income-generating positions in securitized credit, short corporates, and EM equities were maintained, while we increased exposure to non-U.S. equities for capital growth. We also held onto gold and introduced more cash and Treasuries to stay balanced. The way each asset contributed reflects a focus on steady positioning in a market where perspectives—and opportunities—continue to evolve.
Important Disclosures:
Past performance is no indication of future results. there is no guarantee that the investment objective of the strategy will be achieved. index returns reflect the reinvestment of income dividends and capital gains, if any, but do no reflect fees, brokerage commissions or other expenses of investing. Clients must be prepared to bear the risk of a total loss of their investment. The themes and strategies and asset allocations herein are not to be construed as recommendations. They are for illustration purposes only and subject to change without notice.
Returns are presented gross & net of management fees. Gross returns will be reduced by investment advisors fees. Different methods can be applied to the calculation of performance data. Periods over one year is annualized. The deduction of advisory fees and the compounding effect thereof over time will reduce the total return on any account. For example, an account of $10 million with a 1% fee which experienced a 10% compounding annualized total return over a period of five years would result in an ending dollar value of $16,105,100 without the deduction of advisory fees. If an annual advisory fee of 1% were deducted from the account for the same five year period, the annualized return would be 9%, with an ending dollar value of $15,386,240. Additional information regarding policies for calculating and reporting returns is available upon request. A fee schedule is an integral part of a complete presentation and is described in part ii of the firm’s ADV, which is available upon request. Returns include the reinvestment of dividends and other earnings, where applicable.
Certain of the information contained in this presentation is based upon forward-looking statements, information and opinions, including descriptions of anticipated market changes and expectations of future activity. New century advisors believes that such statements, information, and opinions are based upon reasonable estimates and assumptions. However, forward-looking statements, information and opinions are inherently uncertain and actual events or results may differ materially from those reflected in the forward-looking statements. Therefore, undue reliance should not be placed on such forward-looking statements, information and opinions.
The discussion of any investments in this presentation is for illustrative purposes only and there is no assurance that the adviser will make any investments with the same or similar characteristics as any investments presented. The investments identified and described do not represent all of the investments purchased or sold for client accounts. The representative investments discussed were selected based on a number of factors including
investment process and subject matter applicability. The reader should not assume that an investment identified was or will be profitable. There is no assurance that any investments identified will remain in client accounts at the time you receive this document.
CERTAIN PERFORMANCE CALCULATIONS ARE PREPARED INTERNALLY AND HAVE NOT BEEN AUDITED OR VERIFIED BY A THIRD PARTY. THE USE OF A DIFFERENT METHODOLOGY FOR PREPARING, CALCULATING OR PRESENTING PERFORMANCE RETURNS MAY LEAD TO DIFFERENT RESULTS AND SUCH DIFFERENCES MAY BE MATERIAL. YOU MAY NOT RELY ON THIS PRESENTATION AS THE BASIS UPON WHICH TO MAKE AN INVESTMENT DECISION. OPINIONS EXPRESSED ARE NEW CENTURY ADVISOR’S PRESENT OPINIONS ONLY AND ARE SUBJECT TO CHANGES BASED ON MARKET, ECONOMIC AND OTHER CONDITIONS AND MAY NOT ACTUALLY COME TO PASS. ANY HISTORICAL PRICE(S) OR VALUES(S) ARE ALSO ONLY AS OF THE DATE INDICATED.
ONE CANNOT INVEST DIRECTLY IN AN INDEX. The index/benchmark comparisons herein are provided for informational purposes only and should not be used as the basis for making an investment decision. There are significant differences between client accounts and the indices/benchmarks referenced including, but not limited to, risk profile, liquidity, volatility and asset composition. BENCHMARK AND MARKET DATA IS PROVIDED BY A THIRD PARTY.
NEW CENTURY ADVISORS DOES NOT GUARANTEE OR WARRANT THE ACCURACY, TIMELINESS, OR COMPLETENESS OF THIRD PARTY INFORMATION PROVIDED AND IS NOT RESPONSIBLE FOR ANY ERRORS OR OMISSIONS. Please remember that different types of investments involve varying degrees of risk, including the loss of money invested. Therefore, it should not be assumed that future performance of any specific investment or investment strategy, including the investments or investment strategies recommended or proposed by NCA will be profitable.
Bloomberg Bank of America 1-3 Year Treasury Index is an unmanaged index that tracks the performance of the direct sovereign debt of the U.S.
Government having a maturity of at least one year and less than three years. The index is produced by Bloomberg to match the Bank of America Merrill Lynch 1-3 Year Treasury Index.
Bloomberg Bank of America 1 Year Treasury-Bill Index – Is an unmanaged index tracking U.S. government securities. The index is produced by Bloomberg to match the Bank of America Merrill Lynch 1 Year Treasury-Bill Index.
Bloomberg U.S. Aggregate Index is an unmanaged market index which represents securities that are SEC-registered, taxable, and dollar denominated. The index covers the U.S. investment grade fixed rate bond market, with index components for government and corporate securities, mortgage pass-through securities, and asset-backed securities.
Bloomberg U.S. Intermediate Aggregate Index is an unmanaged market index which represents securities that are SEC-registered, taxable, and dollar denominated. The index covers the U.S. investment grade fixed rate bond market, with less than 10 years to maturity. The index components are government and corporate securities, mortgage pass-through securities, and asset-backed securities.
Bloomberg U.S. Treasury Inflation-Linked Bond Index is an unmanaged market index comprised of all U.S. Treasury Inflation Protected Securities rated investment grade or better, having at least one year to final maturity, and at least $500m par amount outstanding.
Bloomberg Global Aggregate Credit Index is broad-based measure of the global investment-grade fixed income markets. The three major components of this index are the U.S. Aggregate, the Pan-European Aggregate, and the Asian-Pacific Aggregate Indices. The index also includes Eurodollar and Euro-Yen corporate bonds, Canadian government, agency and corporate securities, and USD investment grade 144A securities.
Consumer Price Index (CPI) is a measure of the average change over time in the prices paid by urban consumers for a market basket of consumer goods
and services. It is calculated and maintained by the US Bureau of Labor and Statistics.